
Manage all your Restaurants from a Single Dashboard
A centralized dashboard to compare the performance of each location, detect issues before they escalate and make the right decisions across your entire network.
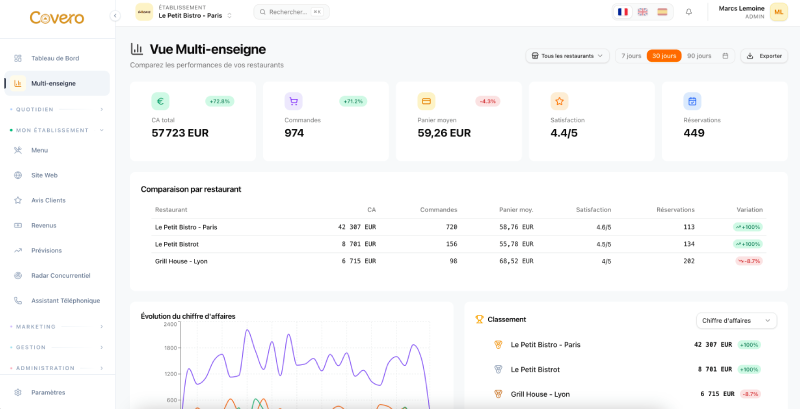
Comparative KPIs
See at a glance the revenue, order count, average basket and customer satisfaction of each restaurant, with variation compared to the previous period.
Smart Alerts
The system automatically detects anomalies and alerts you: revenue drops over 20%, no-show rates exceeding 10%, customer satisfaction below 3.5/5.
Location Ranking
Compare your restaurants across multiple criteria: revenue, orders, average basket, satisfaction, reservations and no-show rate. Identify top performers and areas for improvement.
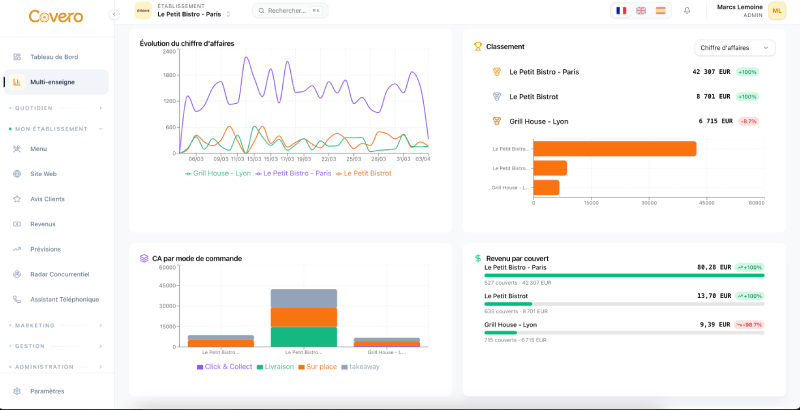
Ranking & Leaderboard
Rank your restaurants by revenue, orders, average basket or satisfaction. Instantly identify your top performers and those requiring attention.
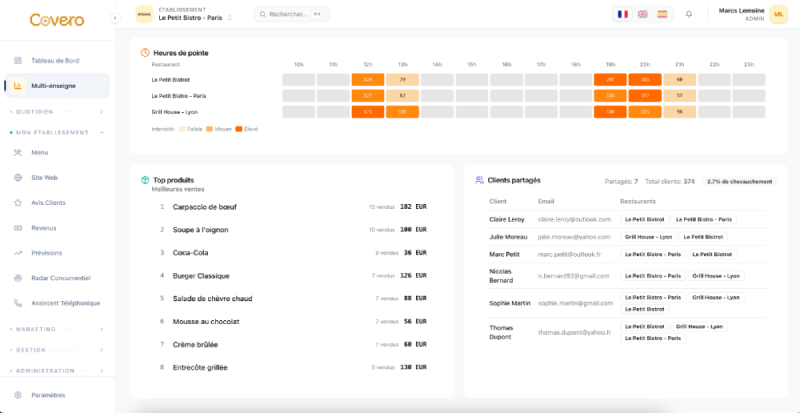
Peak Hours
Visualize peak hours for each restaurant as a heatmap. Identify traffic patterns to optimize schedules and inventory across the network.
Cross-Restaurant Top Products
Analyze the best-selling products across all your locations. Identify common best-sellers and menu standardization opportunities.
Revenue by Sales Channel
Compare revenue distribution by channel (dine-in, takeout, delivery) across your restaurants. Identify underperforming channels per location.
Compare your Restaurants in Real Time.
No more Excel spreadsheets and manual reports. With the Covero multi-location dashboard, you see the performance of all your locations on a single interface. Overlaid revenue curves, comparative KPI tables and dynamic rankings: you identify in seconds which restaurant is performing and which needs attention.
Detect Problems Before your Customers.
The system continuously monitors key indicators for each restaurant and automatically alerts you when anomalies occur. Sudden revenue drop, no-show spike, satisfaction decline: you are warned before the situation deteriorates, with concrete action recommendations.
Understand your Customers Across the Network.
Identify customers who visit multiple locations. Analyze the overlap rate between restaurants, spot cross-loyalty opportunities and build loyalty programs at network scale. Valuable data to turn your multi-site customers into ambassadors for your group.
Frequently asked questions about the multi-location dashboard.
The multi-location dashboard is available from 2 restaurants. It is designed for groups, franchises and multi-site restaurateurs who want to centralize the management of their locations. The more restaurants you have, the greater the added value of the tool thanks to comparative analyses and network-wide anomaly detection.
The dashboard compares revenue, order count, average basket, customer satisfaction (based on reviews), reservations, no-show rate, revenue by sales channel (dine-in, takeout, delivery), revenue per cover and peak hours. Each indicator is displayed with its variation compared to the previous period for immediate trend tracking.
The system continuously monitors the KPIs of each restaurant and automatically triggers an alert when a threshold is crossed: revenue drop over 20%, no-show rate exceeding 10%, or customer satisfaction below 3.5/5. These alerts are visible directly in the dashboard and allow you to act before the situation deteriorates.
Yes, a multi-select filter lets you choose which restaurants to compare. You can analyze your entire network or focus on a specific subgroup (by geographic area, by concept, etc.). A minimum of 2 restaurants must be selected for the comparison to be meaningful.
Absolutely. A CSV export button lets you download all dashboard data for in-depth analysis in Excel or any other reporting tool. Exports include KPIs, rankings, reservation data and customer analytics.
Discover our other solutions
Reservations
Reservation widget, digital floor plan and anti no-show.
Artificial Intelligence
AI-powered attendance prediction and staff optimization.
Loyalty
Mini-games, customer database and targeted marketing campaigns.
Google Reviews & Reputation
Automatic review collection and online reputation monitoring.
Ready to manage your network?
Contact our team to discover how the Covero multi-location dashboard can transform the management of your restaurant group.
Request a demo